Structure-from-Motion (SfM): Testing Accessible Photogrammetry Methods
Exercise
Introduction
This project demonstrates a photogrammetry method known as structure-from-motion (SfM) to create visual representations of the target landscape Dimple Dell Park in Sandy, Utah utilizing drone technology. Ground control points (GCP) were implemented for two drone flight patterns over the same region: east to west and north to south transect lines, the latter also known as the lawnmower pattern.
The goal was to better understand how GPS error propagates to mapped location and georeferencing uncertainty, to better understand how flight parameters impact surface reconstruction from SfM methods, its relative accessibility popularized by M.J. Westoby, and to better understand the most ideal flight pattern by analyzing models generated. The hypothesis is that neither the east-to-west or north-to-south routes would more faithfully represent the physical landscape more than the other after conducting the terrain analysis—the reasoning is the automatic piloting and interval photo capture, and if there does exist any difference it’d be due to inclement weather.
Methods and Tools
Tools used on-site include six DIY colored duct tape GCPs, a Trimble Juno 3B, a rented DJI Mavic 2 Pro drone with the accompanying DJI GO 4 mobile smartphone application to control the device, and the Pix4Dcapture mobile smartphone application to plan the drone’s flight route. The data was recorded at Dimple Dell Park at coordinates 40.5690027, -111.8126347 on Thursday, October 10th, 2021 from 2:37 P.M. to 4:42 P.M with cloudy 39℉ (3.89℃) weather. The GCPs were set down first to four corners and then two placed inside the rectangular boundary, studies determined five to six GCPs were a suitable number (Oniga et al., 2020) (Yu et al., 2020), and considering the area was smaller it wasn’t necessary to place more. Afterward, the GCPs’ coordinates were recorded with the Trimble. Then, the drone was paired with an Apple iPhone and the corresponding applications DJI GO 4 and Pix4Dcapture to create the transect east-to-west pathway to automate the first east-to-west flight, which was located at coordinates 40.569056, -111.812491 at 4:08 P.M. It took approximately 6:49 minutes to complete the 915 feet route with a dimension of 201 feet by 86 feet, ending at 4:14 P.M.—the settings were set at 2 second camera shutter intervals, 35 feet for the altitude, and 90° for the camera angle, which resulted in an estimated 70% to 80% overlap and 136 photos total.
The second north-to-south flight was located at coordinates 40.569007, -111.812586 at 4:24 P.M. There were some take-off issues, but it took approximately 8:13 minutes to complete the 1,196 feet route with a dimension of 103 feet by 193 feet, ending at 4:32 P.M.—the settings remained constant, with another estimated 70% to 80% overlap and 112 photos total.
Tools that were used to post-process the acquired data from the field session include a laptop to run three specific desktop applications: GPS Pathfinder Office, Agisoft Metashape, and ArcGIS Pro. Specifications being Intel(R) Core(TM) i7-7700HQ CPU @ 2.80GHz 2.81 GHz, 8 GB RAM, and NVIDIA GeForce GTX 960M GPU.
After the points and photos were taken at the target site, they were uploaded to Google Drive and were downloaded to local storage. GPS Pathfinder was used to correct the raw GNSS coordinates that were recorded by the Trimble device. The raw points were converted into .ssf files then differentially corrected into .cor files then exported into a .csv file in order to use in ArcGIS Pro. The difference was calculated by comparing the calculated position of the GPS units into the actual position of the stationary base station, which was in Riverton because it had the highest integrity index. The post-processing took around an hour.
Next was modeling the target location’s area itself by creating terrain analysis models such as a digital elevation model (DEM) and an orthomosaic, taking from parts of SfM’s workflow. This is where Agisoft Metashape was used; the first east-to-west flight photos were imported into the project’s chunk and were aligned with high accuracy, 40,000 keypoint limit, and 1,000 tie point limit, which took about thirty minutes. This first model of the flight was to construct it without the corrected GCP points, so the dense cloud was constructed afterward without any georeferencing, with medium quality and mild depth filtering for a detailed foreground, which took about an hour.
The DEM was built next, with a geographic WGS 1984 projection, dense cloud source, and disabled interpolation to avoid the artificial smoothing texture, which took around a minute. The orthomosaic was created with the same aforementioned process as the DEM without the interpolation as an option, which took about an hour. Due to the lack of GCP points as they were cut off in several photos, the program went off of the drone’s GPS and internal gyroscope. The computational processing, in total, took between 2.5 and 3 hours.
The same flight in a separate chunk was done again to account for the corrected GCPs. The photos were aligned, but were aligned without the tagged information in each of the photos with the same settings. Before creating the dense cloud, the .csv file with the corrected GCP points were imported, and the software created targets from them—the photos were all manually georeferenced before creating the dense cloud with the same settings as the non-georeferenced flight for proper comparison.
The process for the DEMs and orthomosaic were also the same, and the second north-to-south flight also followed the same workflow as the chunk with the georeferenced corrected GCP points. The DEMs and orthomosaics for all flights were subsequently downloaded into .tif files. All of the processing in GPS Pathfinder and Agisoft Metashape took over nine hours, but less than ten hours.
Those above mentioned files were then imported into an ArcGIS project as well as the corrected GCP points in several different layers. Hillshade and Slope terrain analyses were conducted using the spatial analyst geoprocessing tools built into the application, using the DEM as the base reference. The altitude difference was calculated using the Minus geoprocessing tool between the first flight (east-to-west) and the second flight (north-to-south), both with GCPs, using their DEMs. After the symbologies were changed to Stretch, the data was organized with the Equalized Histogram option to better differentiate the landscape scenery before exporting the maps.
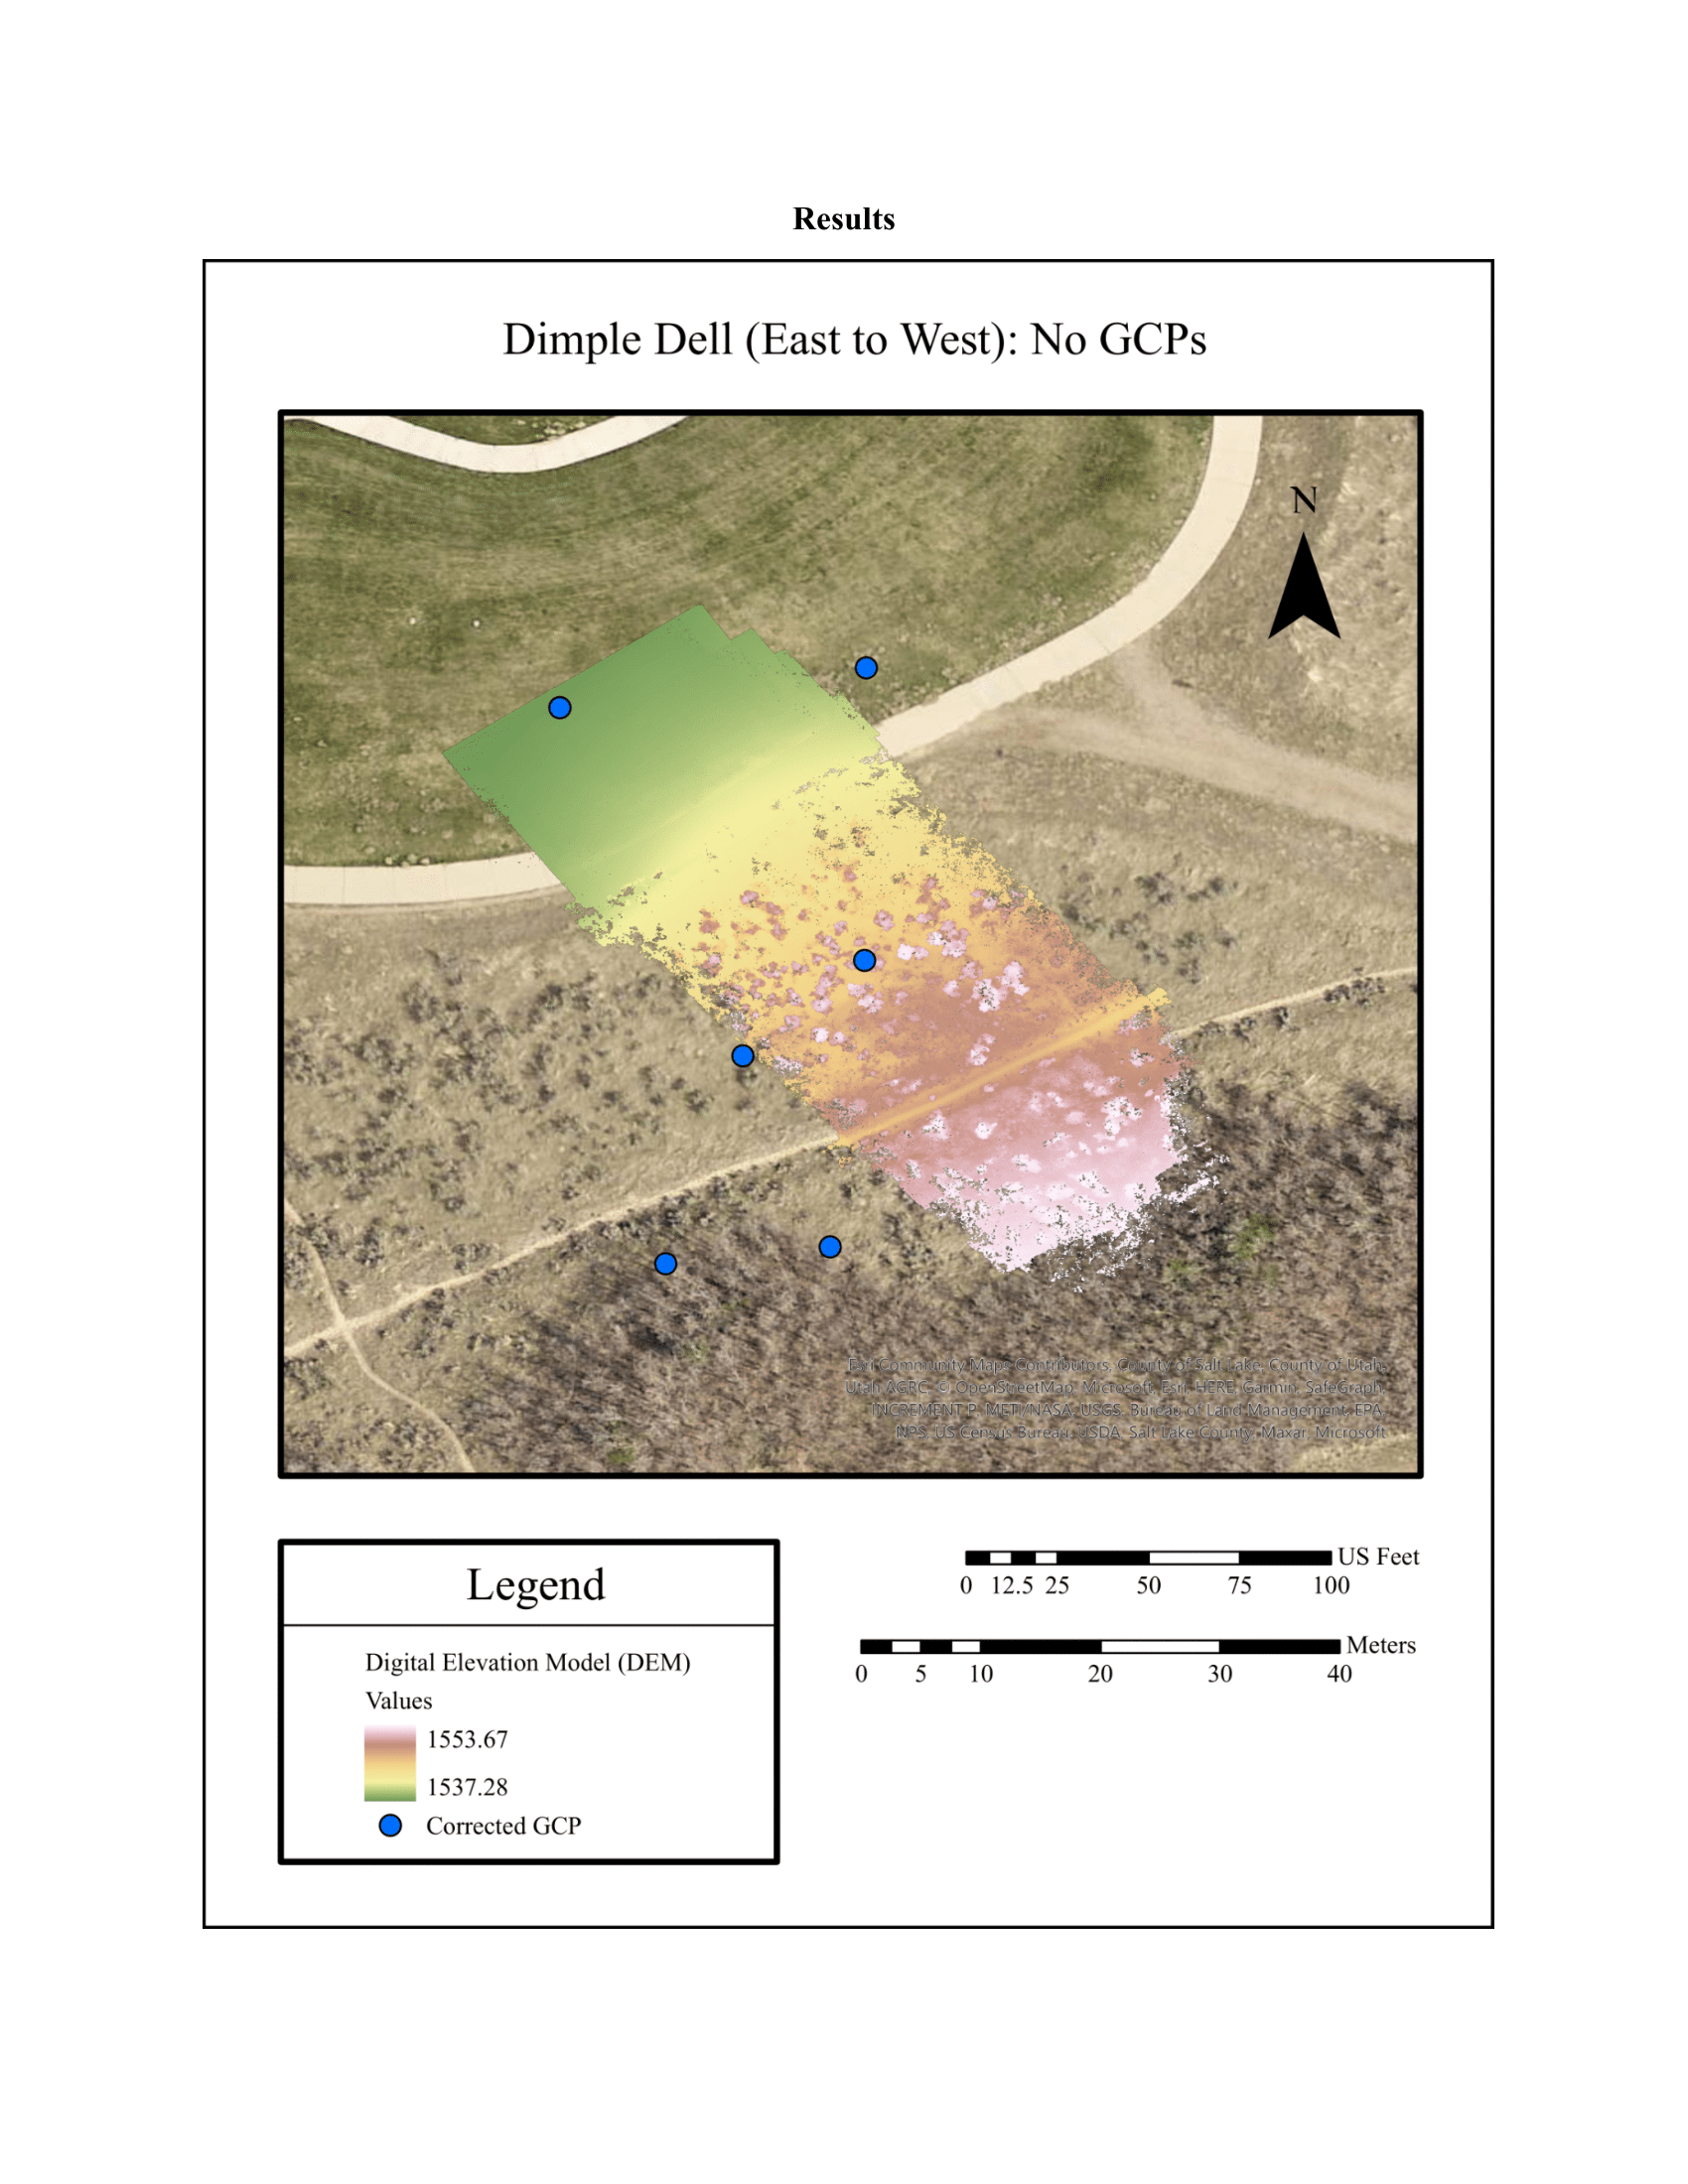



Dimple Dell (East-to-West): No GCPs
The above flight shows the first east-to-west flight and did not utilize any GCPs in order to georeference the photographs that were taken with the drone, but the points were input as a legend layer on the map. The GCPs’ coordinates do not align with the drone’s automated pathway within the Pix4Dcapture application. The symbology used for the DEM layer is Surface with a satellite image base map, and shows that the target area is relatively flat, with the lowest value being 1,537.28 and the highest value being 1,553.67 for the interval.
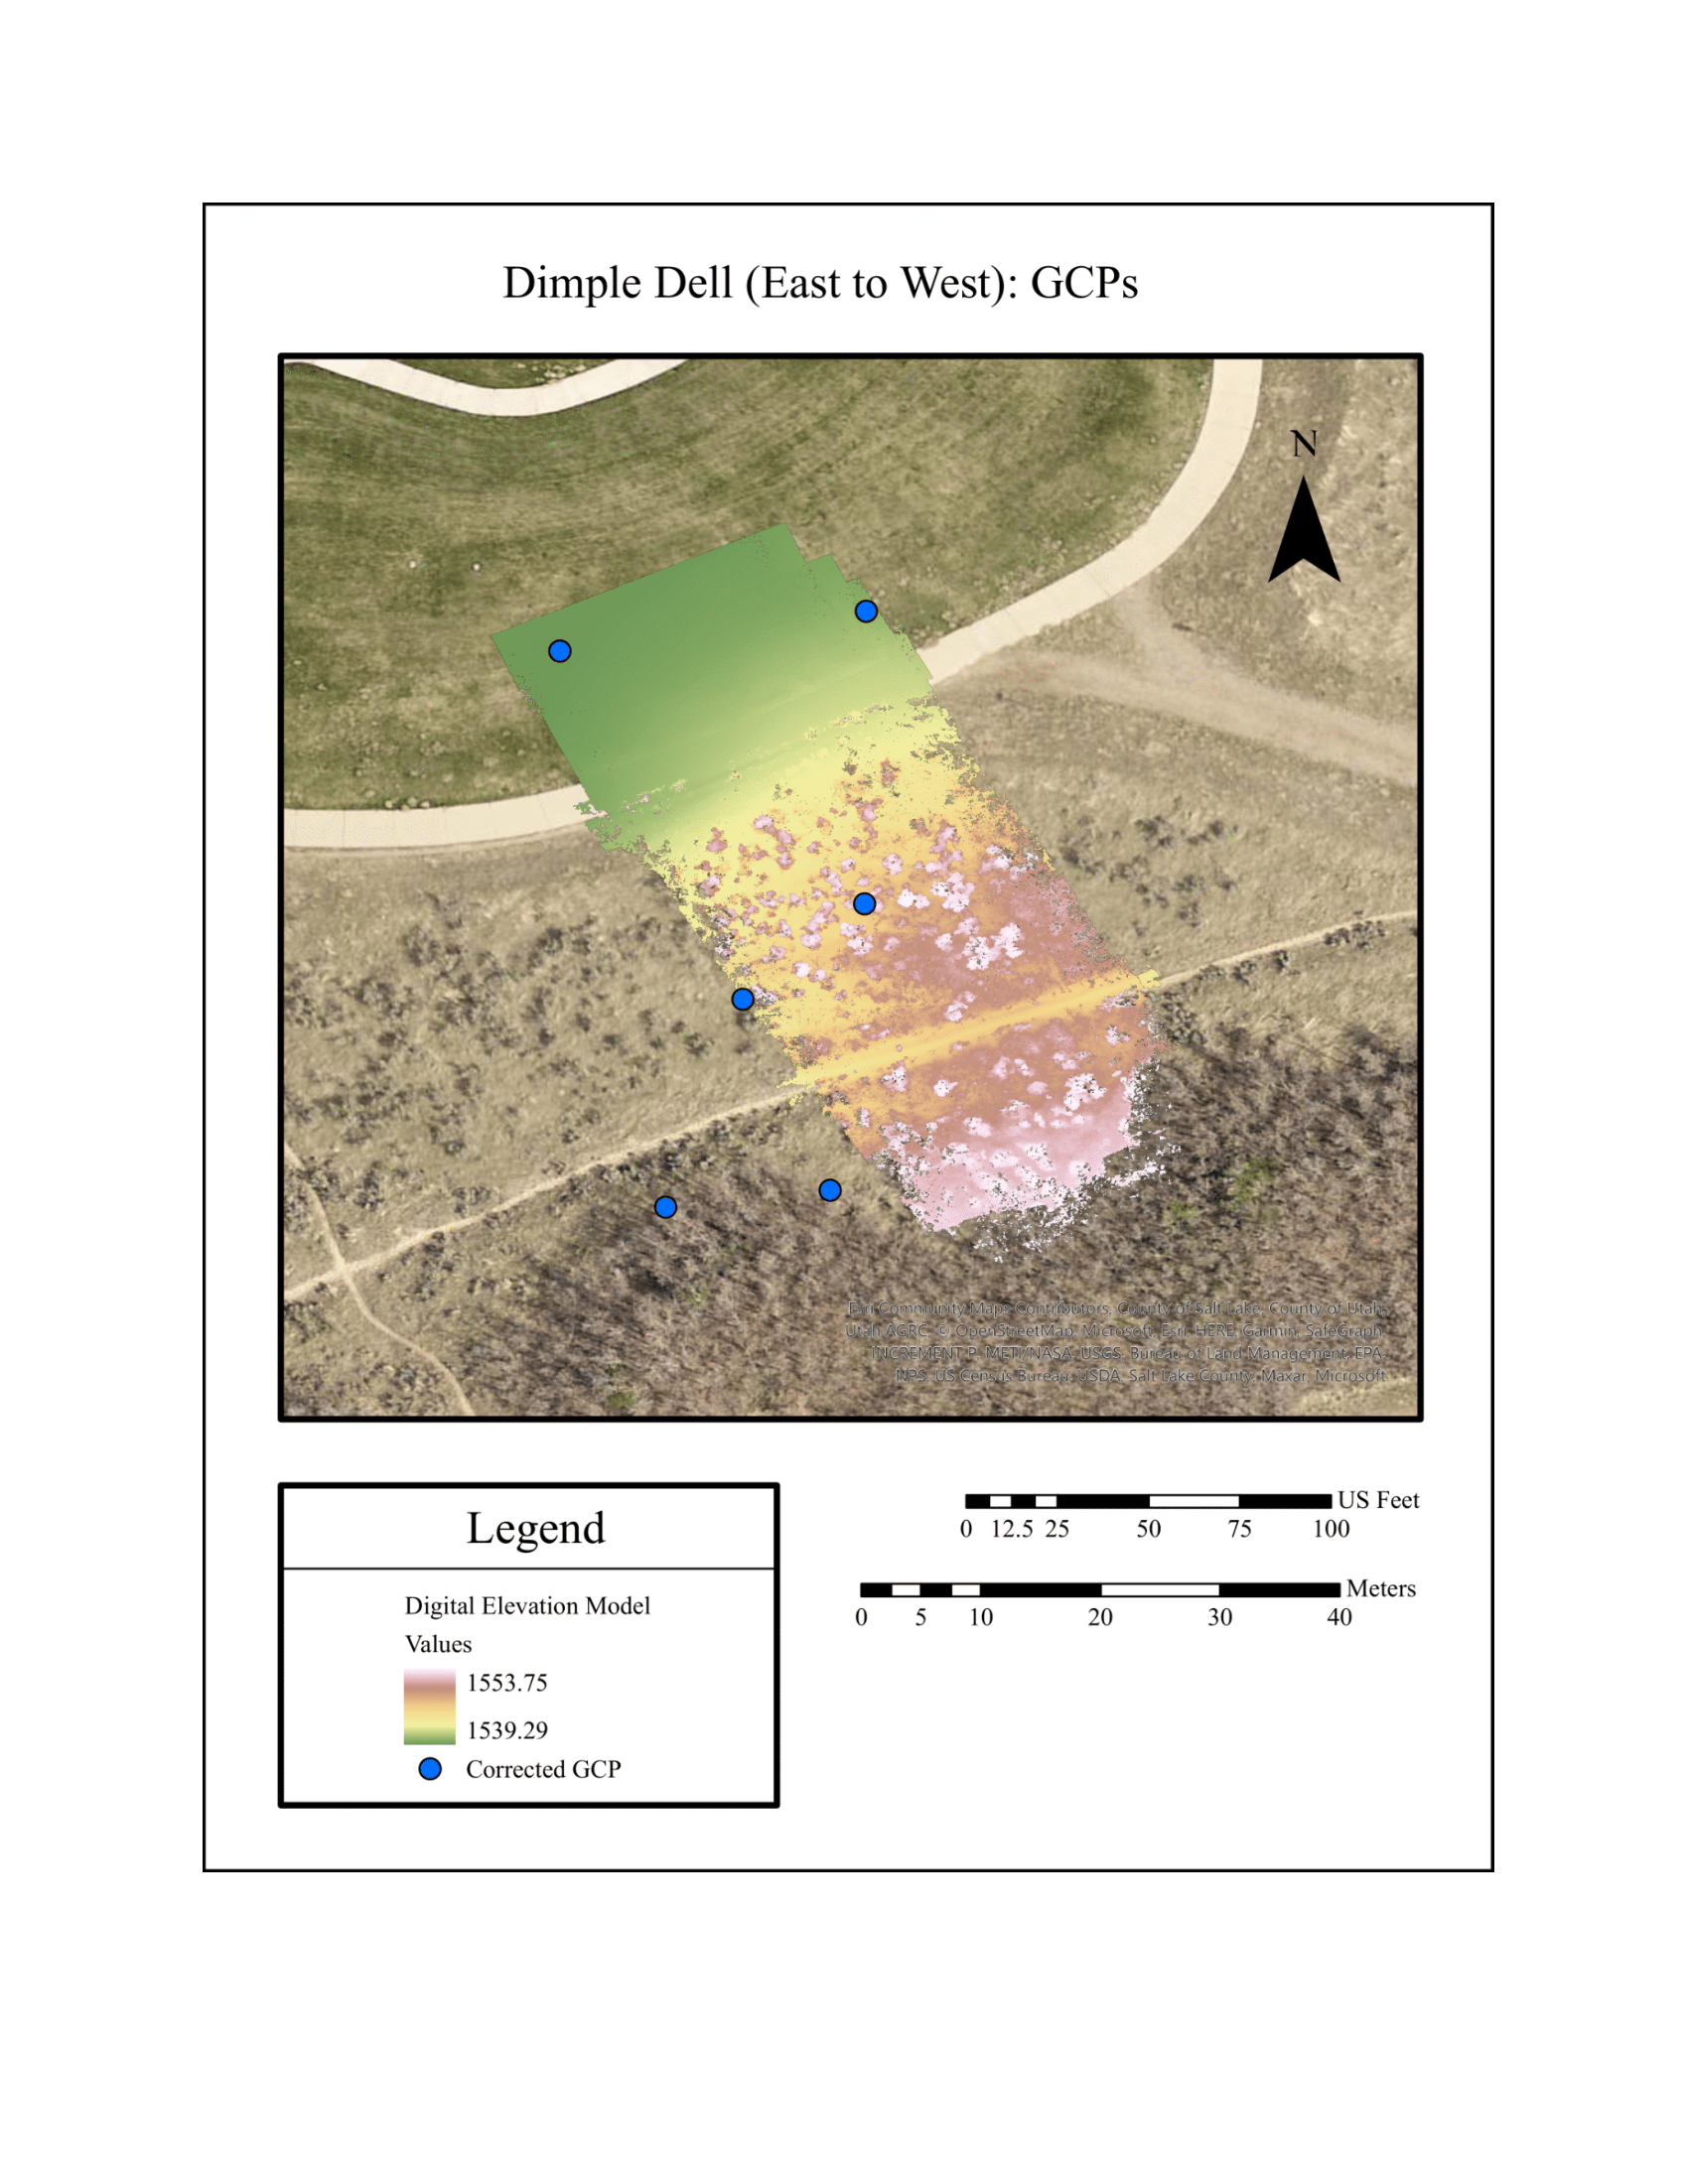
Dimple Dell (East-to-West): GCPs
The above flight shows the first east-to-west flight again, but this time utilizing GCPs in order to georeference the photographs that were taken with the drone with the points input as a legend layer on the map. The GCPs’ coordinates do not align with the drone’s automated pathway within the Pix4Dcapture application again, even though this model is georeferenced, which can be attributed to the GCP placements. The symbology used for the DEM layer is Surface with a satellite image base bap, and shows that the target area is relatively flat, with the lowest value being 1,539.29 and the highest value being 1,553.75 for the interval.
Dimple Dell (East-to-West): Orthomosaics
The above flight showcases two orthomosaics overlaid on top of one another—both the layers are from the first east-to-west flight over Dimple Dell, but one is corrected (top layer) while the other is uncorrected (bottom layer). Comparing the two, the uncorrected layer was skewed, rotating left. However, the corrected top layer after georeferencing the GCPs shows a more accurate alignment with the base map, even if there were only 3 to 4 viable GCPs used when looking at the previous maps.
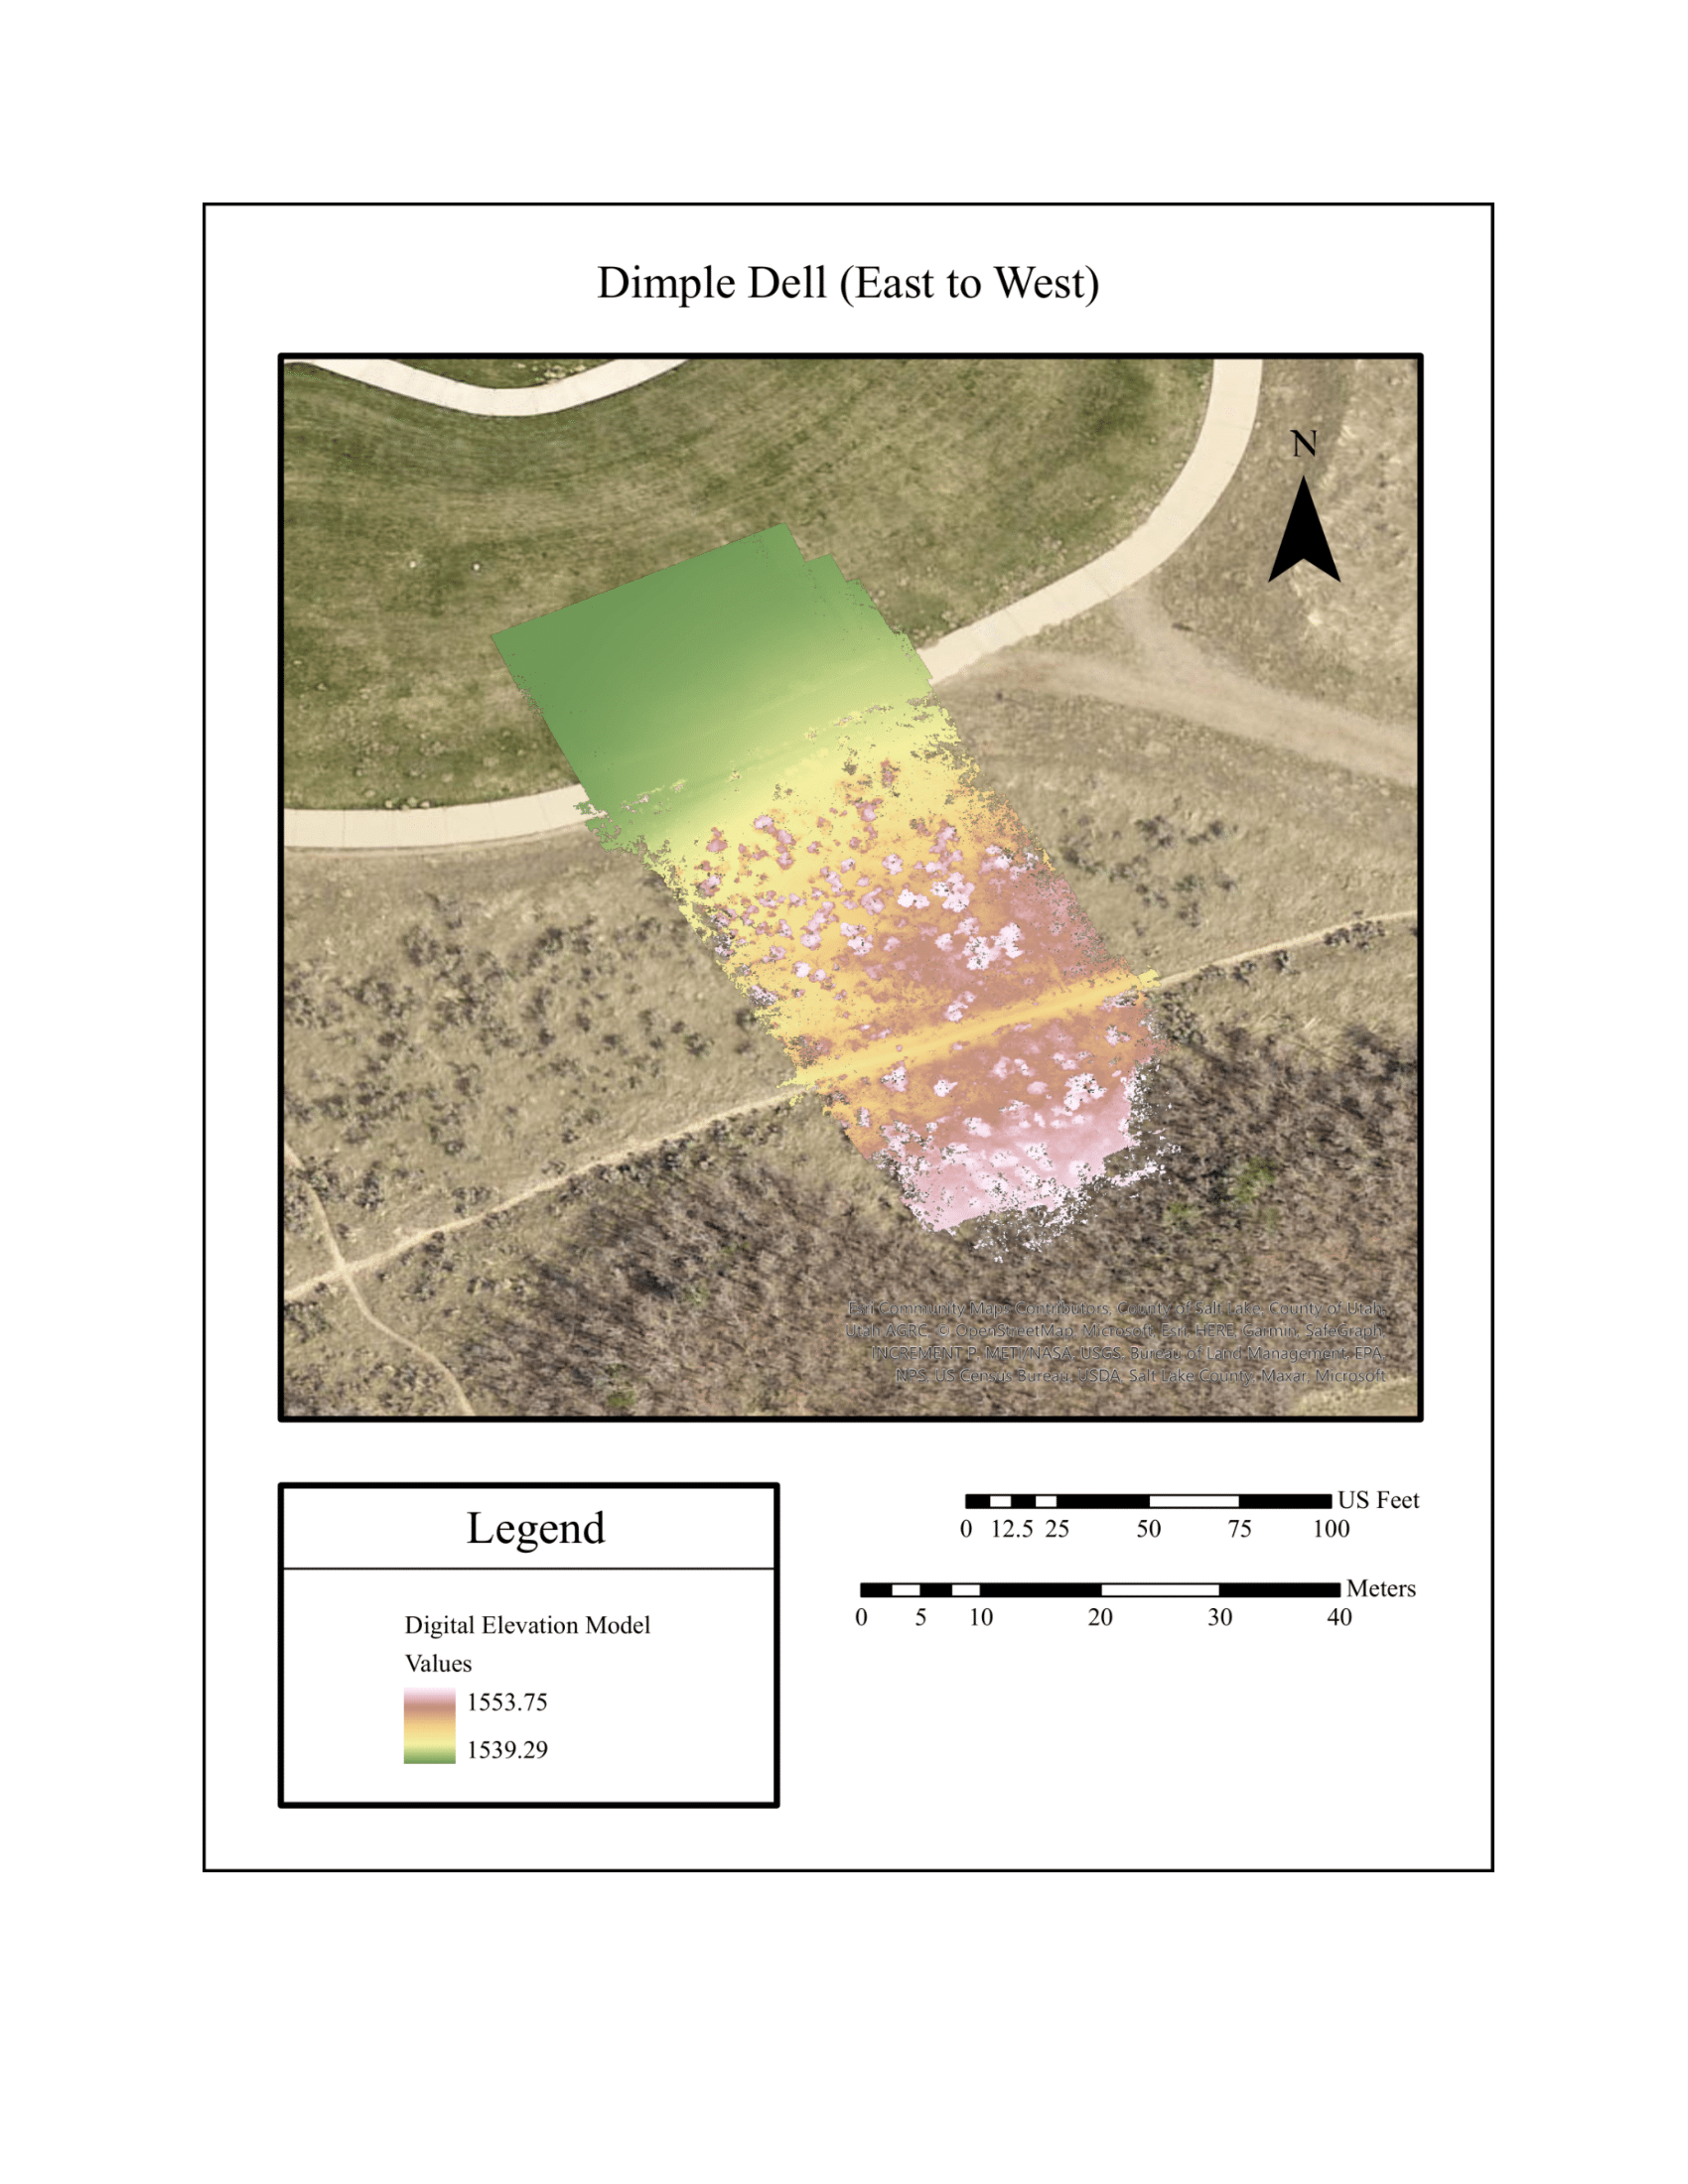
Dimple Dell (East-to-West)
The above flight exhibits the first east-to-west flight’s DEM with values ranging from 1,539.29 to 1,553.75 with a Surface symbology over a satellite image base map.
Dimple Dell (North-to-South)
The above map shows the second north-to-south flight over Dimple Dell with the lowest value being 1,526.28 ranging to the highest value being 1,534.22, accompanied by the Surface symbology and a satellite image base map. This flight used corrected GCP points to georeference, and is much wider at 103 x 193 feet and a 1,196 feet path compared to the narrower first flight at 201 x 86 feet and a 915 feet path. Despite the georeferencing, the DEM is shifted significantly downward, but maintains the terrain integrity judging from the curved sidewalk and footpath.
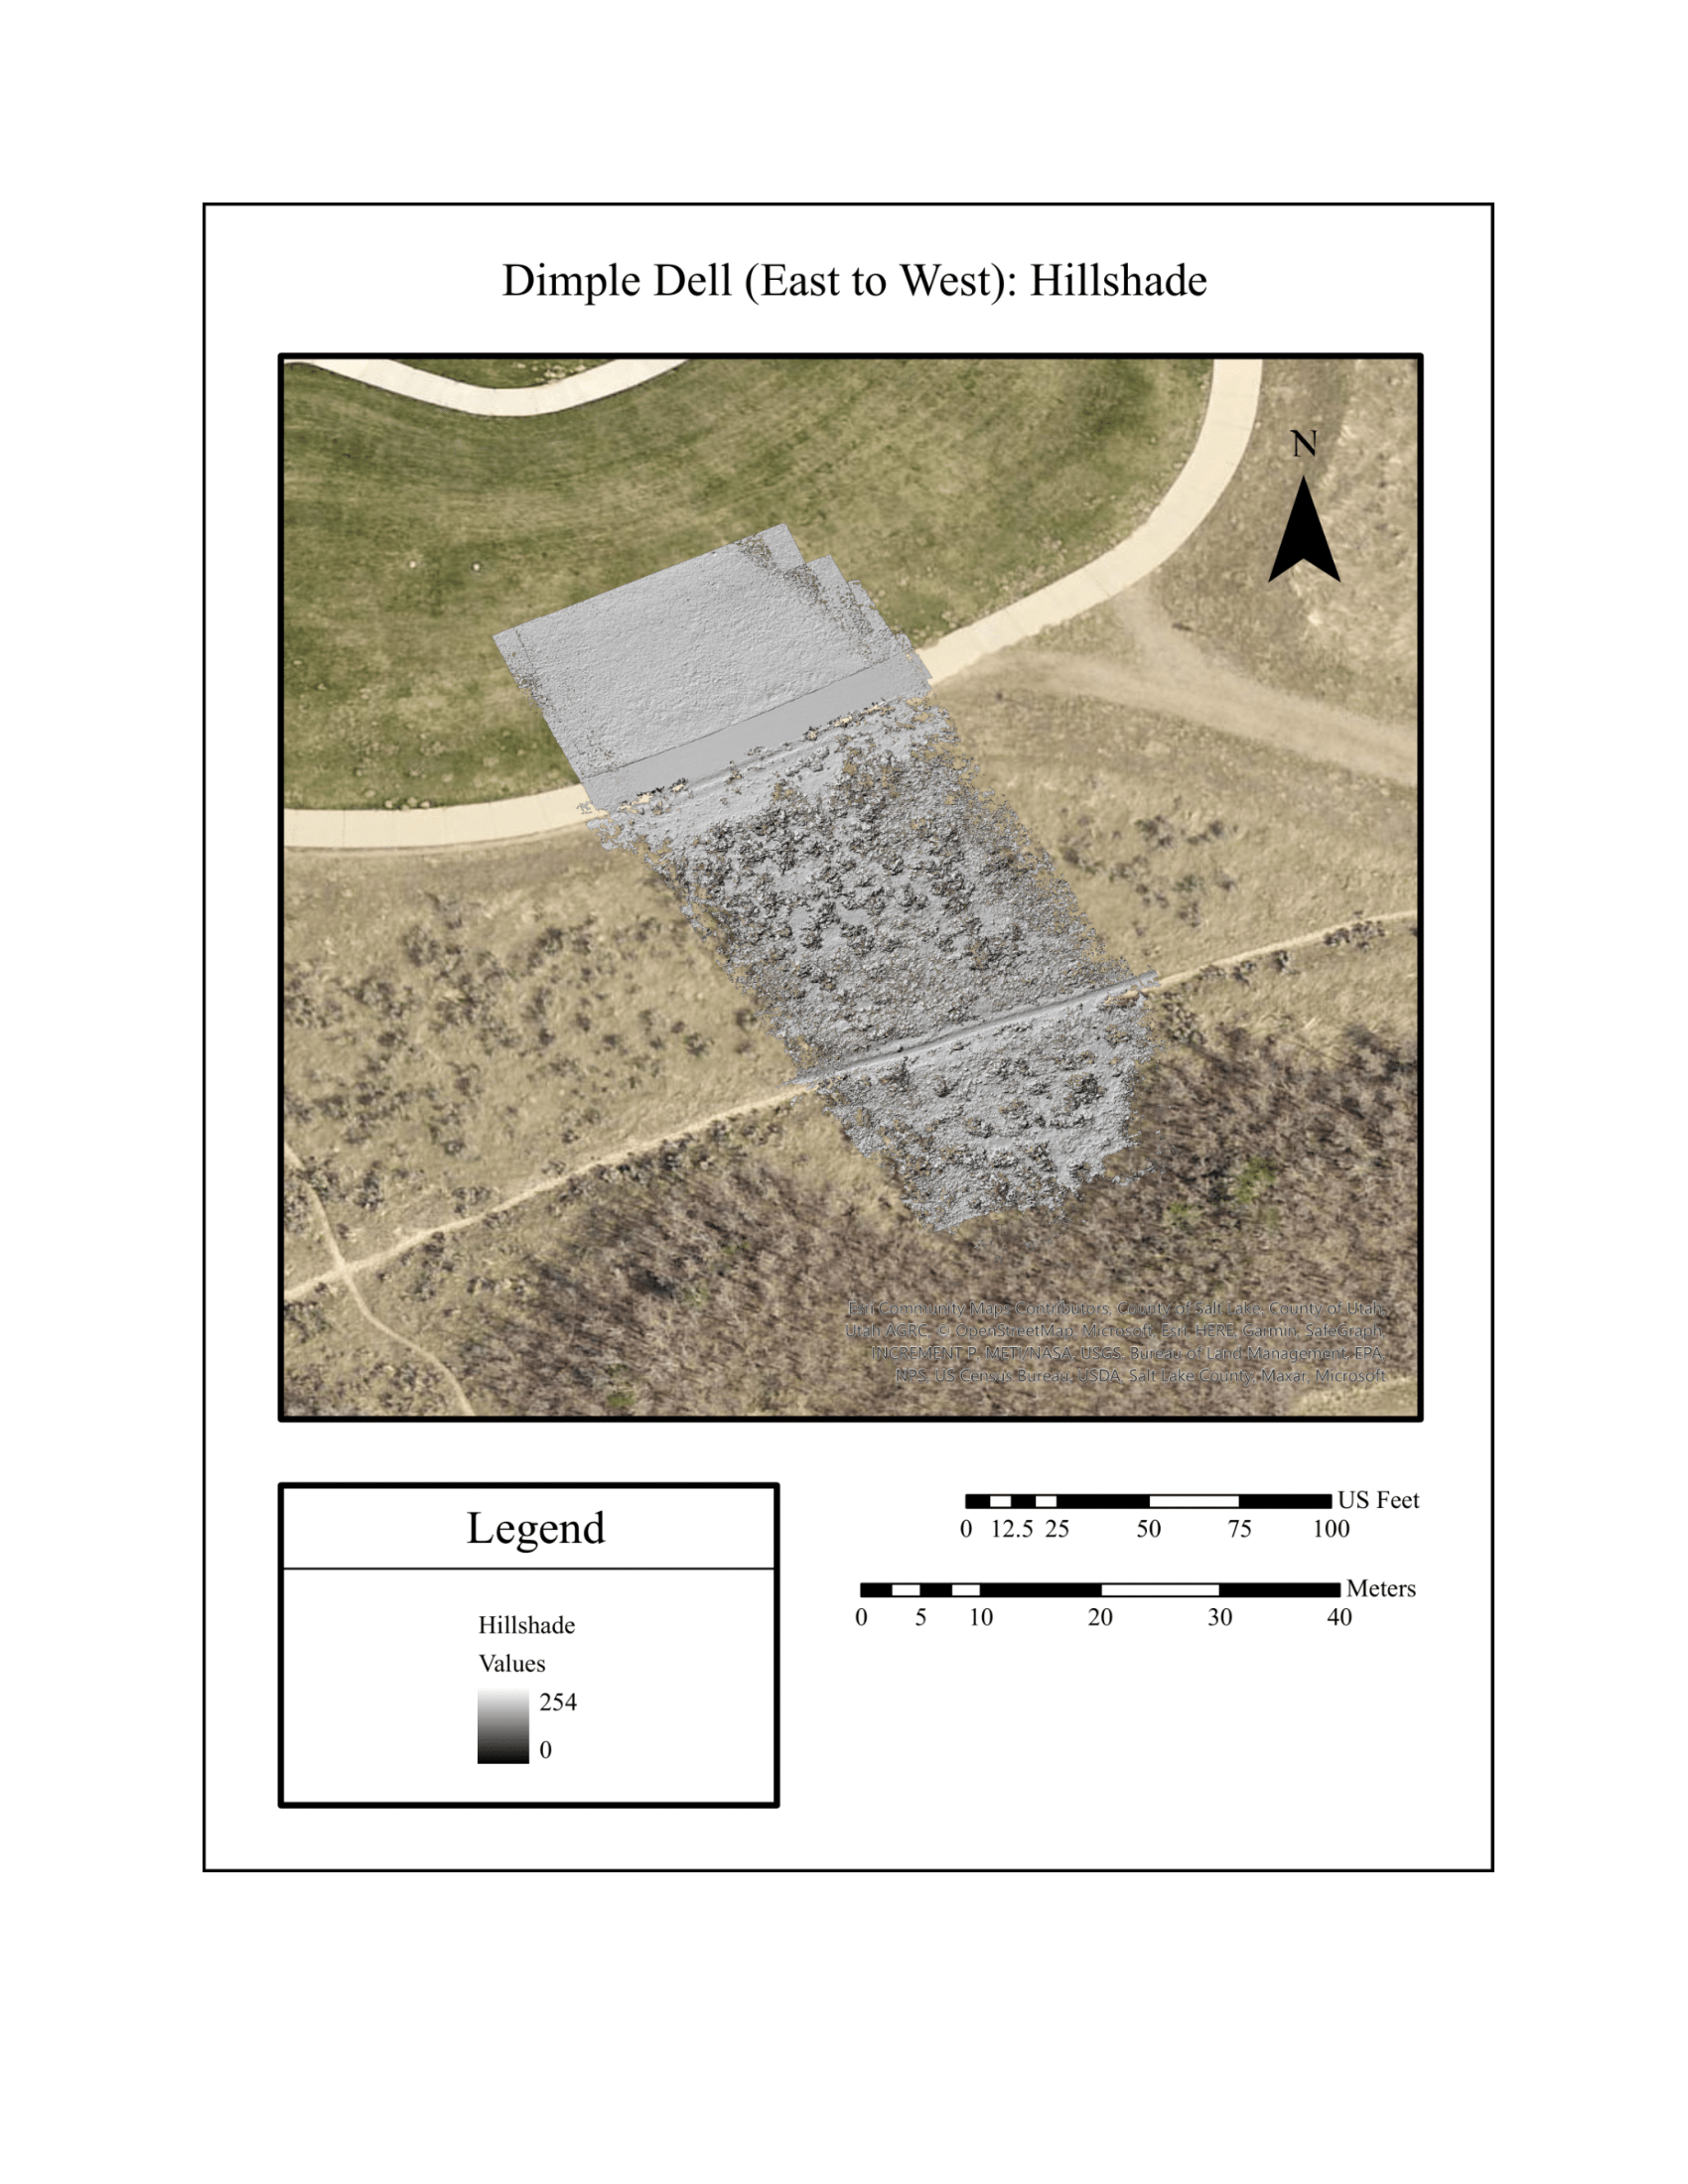
Dimple Dell (East-to-West): Hillshade
The above map shows the first east-to-west flight’s hillshade with corrected GCP georeferencing after running ArcGIS’ built-in hillshade tool with values ranging from the lowest 0 to the highest 254; the terrain is very flat with darker values surrounding the foliage and sidewalk edges captured in the model. The symbology used is Grayscale with a satellite image base map.
Dimple Dell (North-to-South): Hillshade
The above map shows the second north-to-south flight’s hillshade with corrected GCP georeferencing after running ArcGIS’ built-in hillshade tool with values ranging from the lowest 0 to the highest 254. The misalignment is much more prominent in this hillshade map, seeing the sidewalk and footpath shifted downward. The symbology used is Grayscale with a satellite image base map.
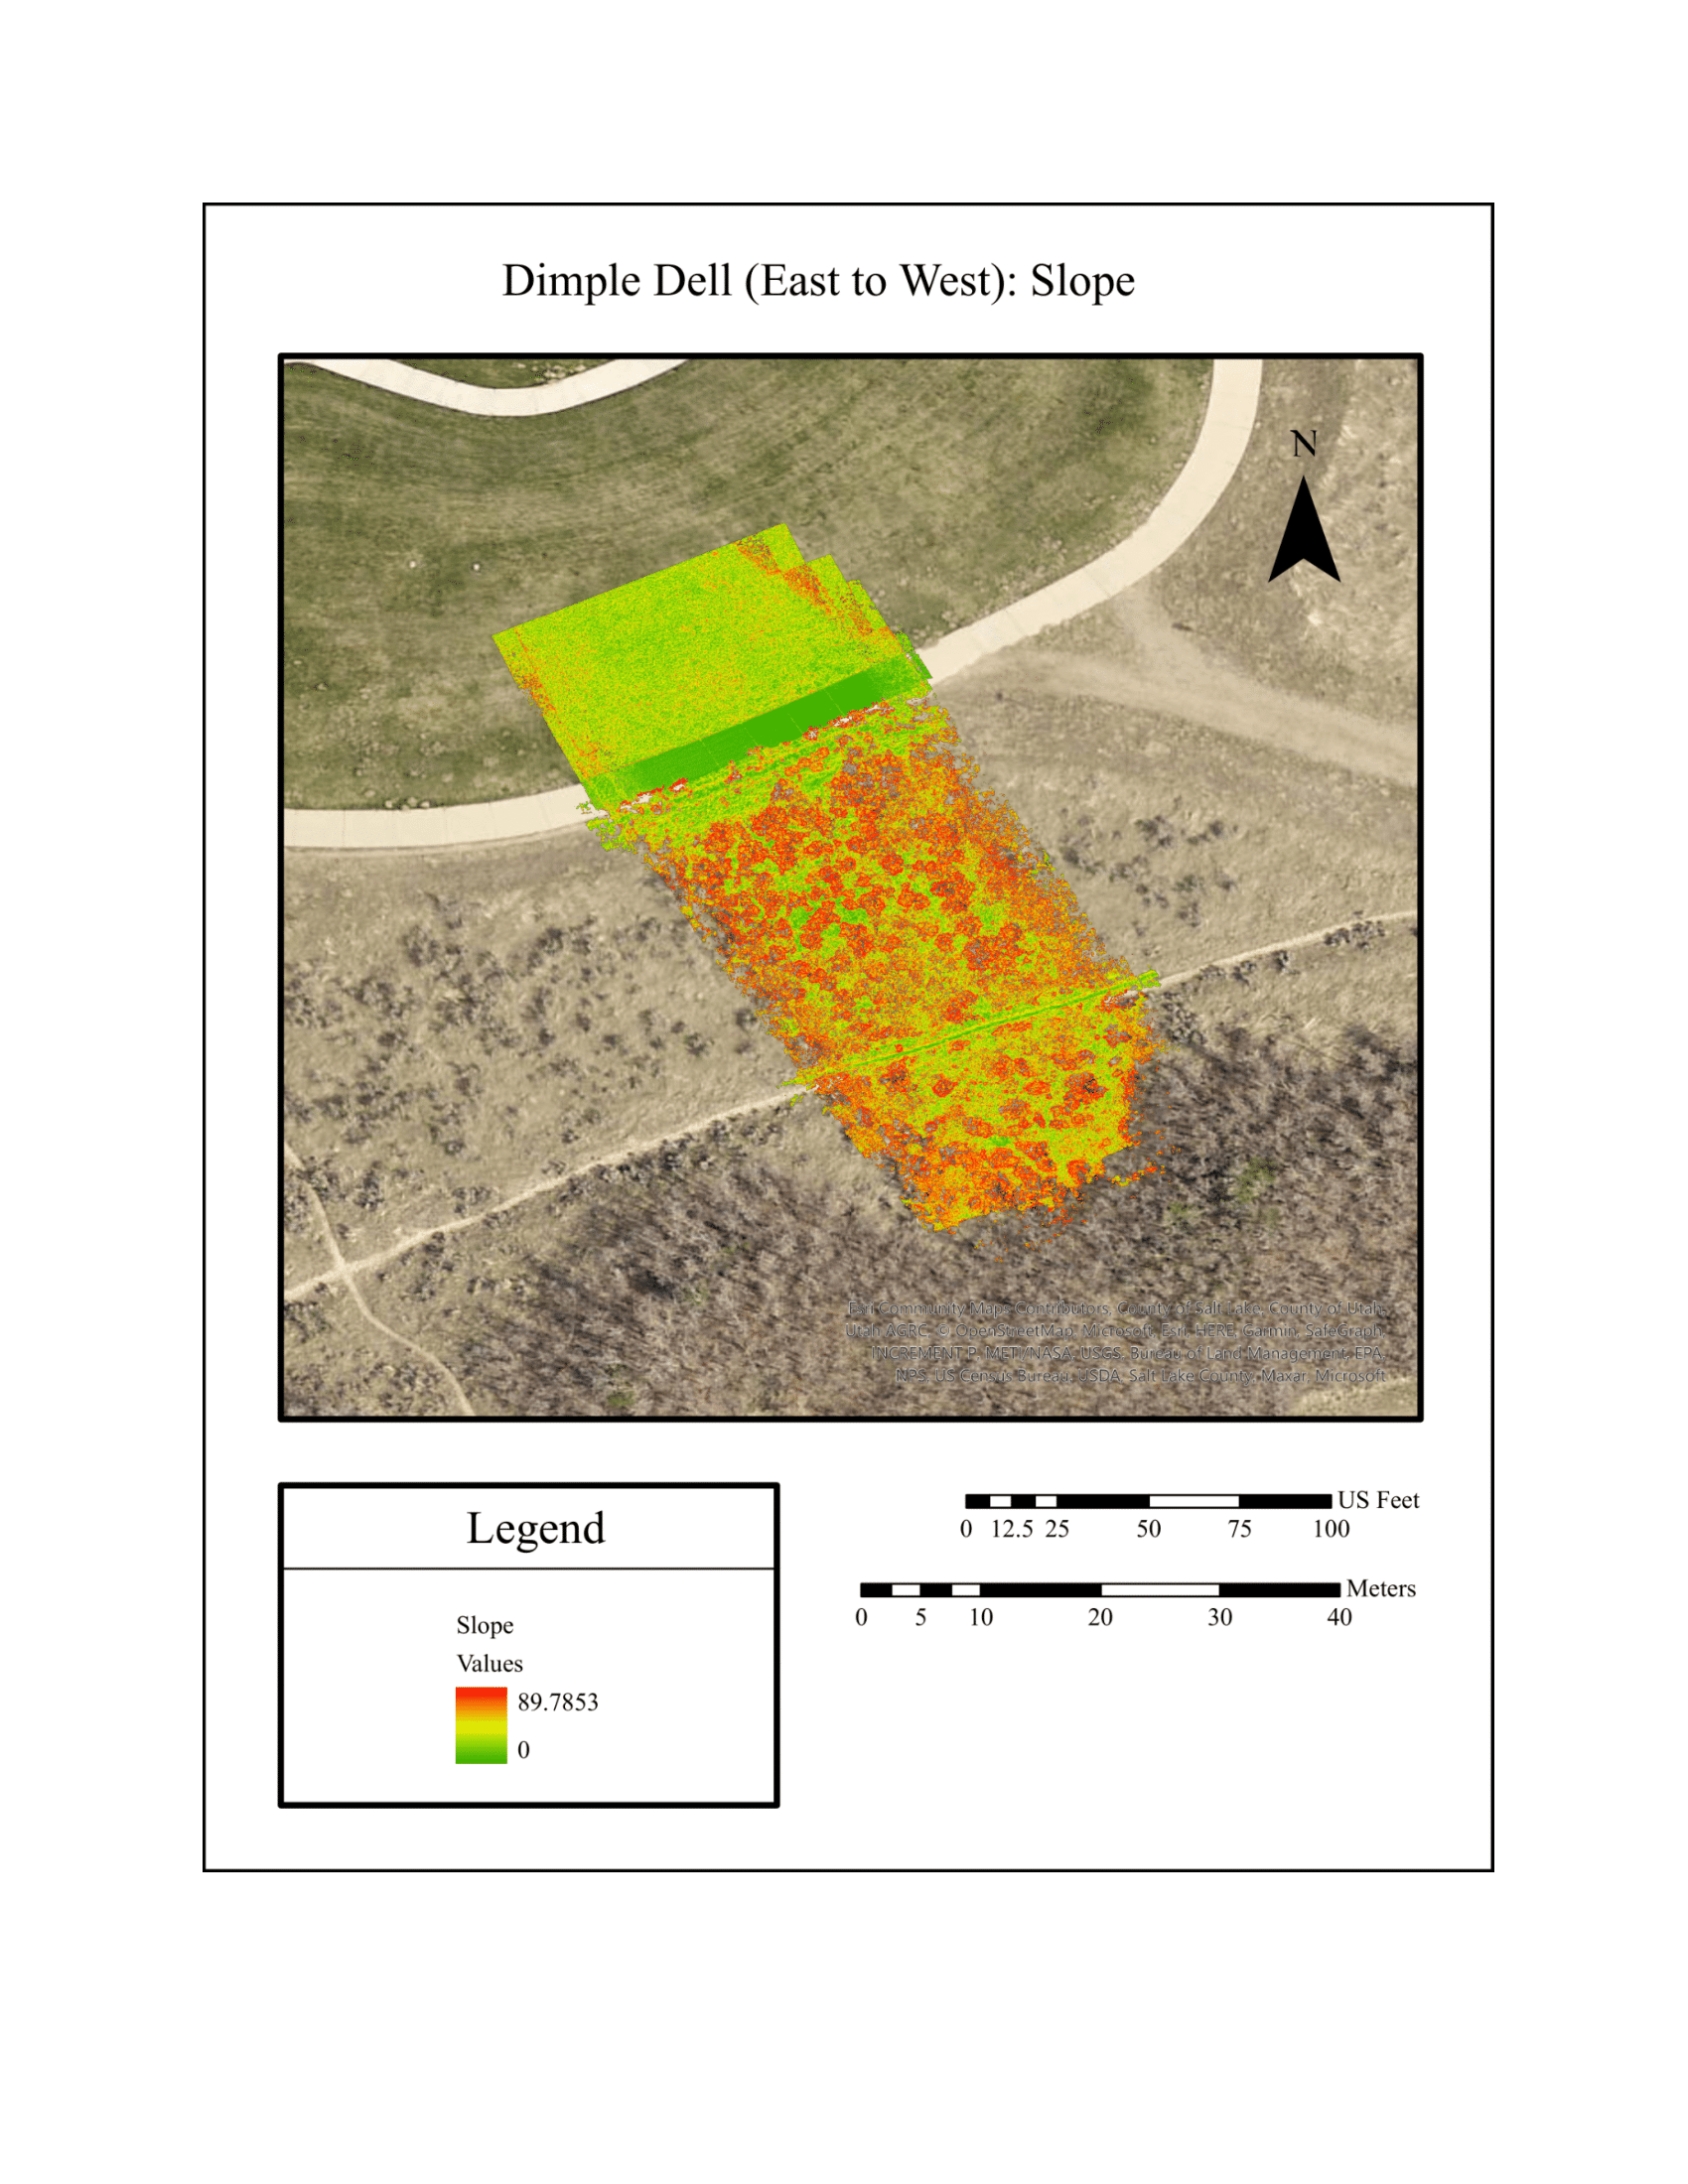
Dimple Dell (East-to-West): Slope
The above map represents the first east-to-west flight with corrected GCPs georeferenced for it. The values range from 0 to 89.7853 for the slope terrain analysis; the rate of change in slope is significant when comparing the flat grass and paths to the foliage rise that was recorded. The symbology used is Slope with a satellite image base map.
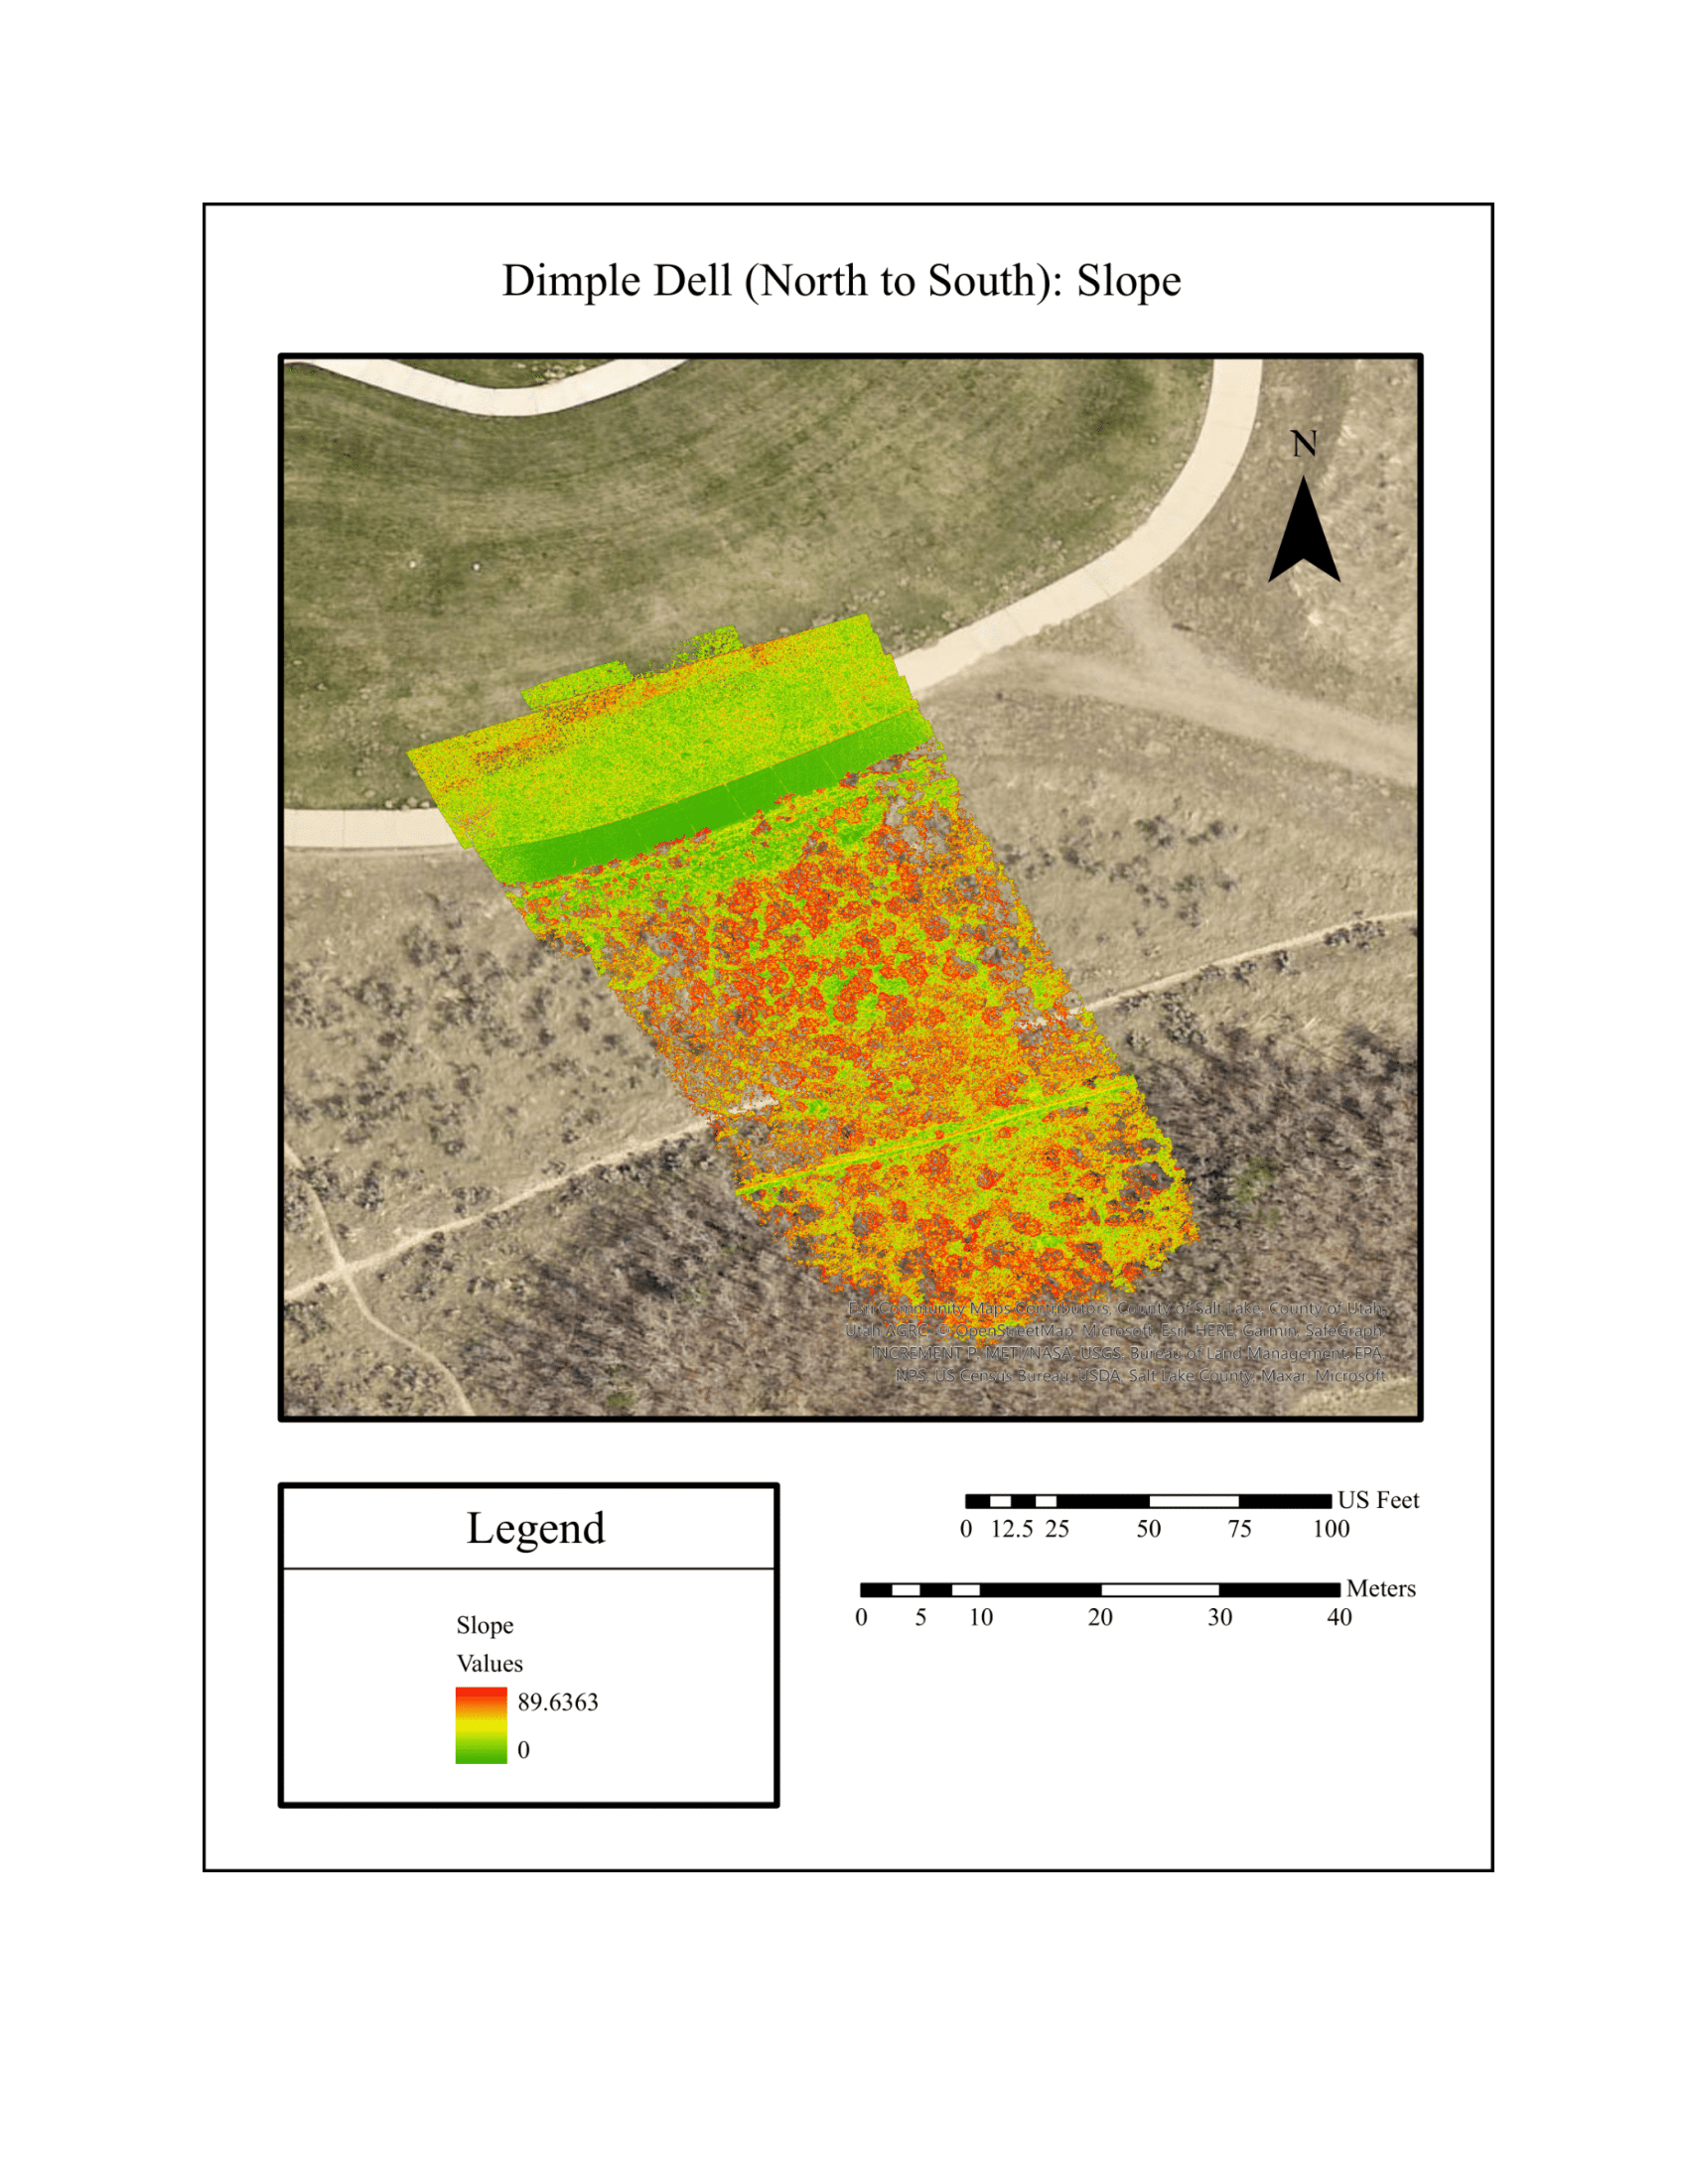
Dimple Dell (North-to-South): Slope
The above map represents the second north-to-south flight with corrected GCPs georeferenced for it. The values range from 0 to 89.6363 for the slope terrain analysis. This one is not lined up as neatly as the previous flight’s mapping. The symbology used is Slope with a satellite image base map.
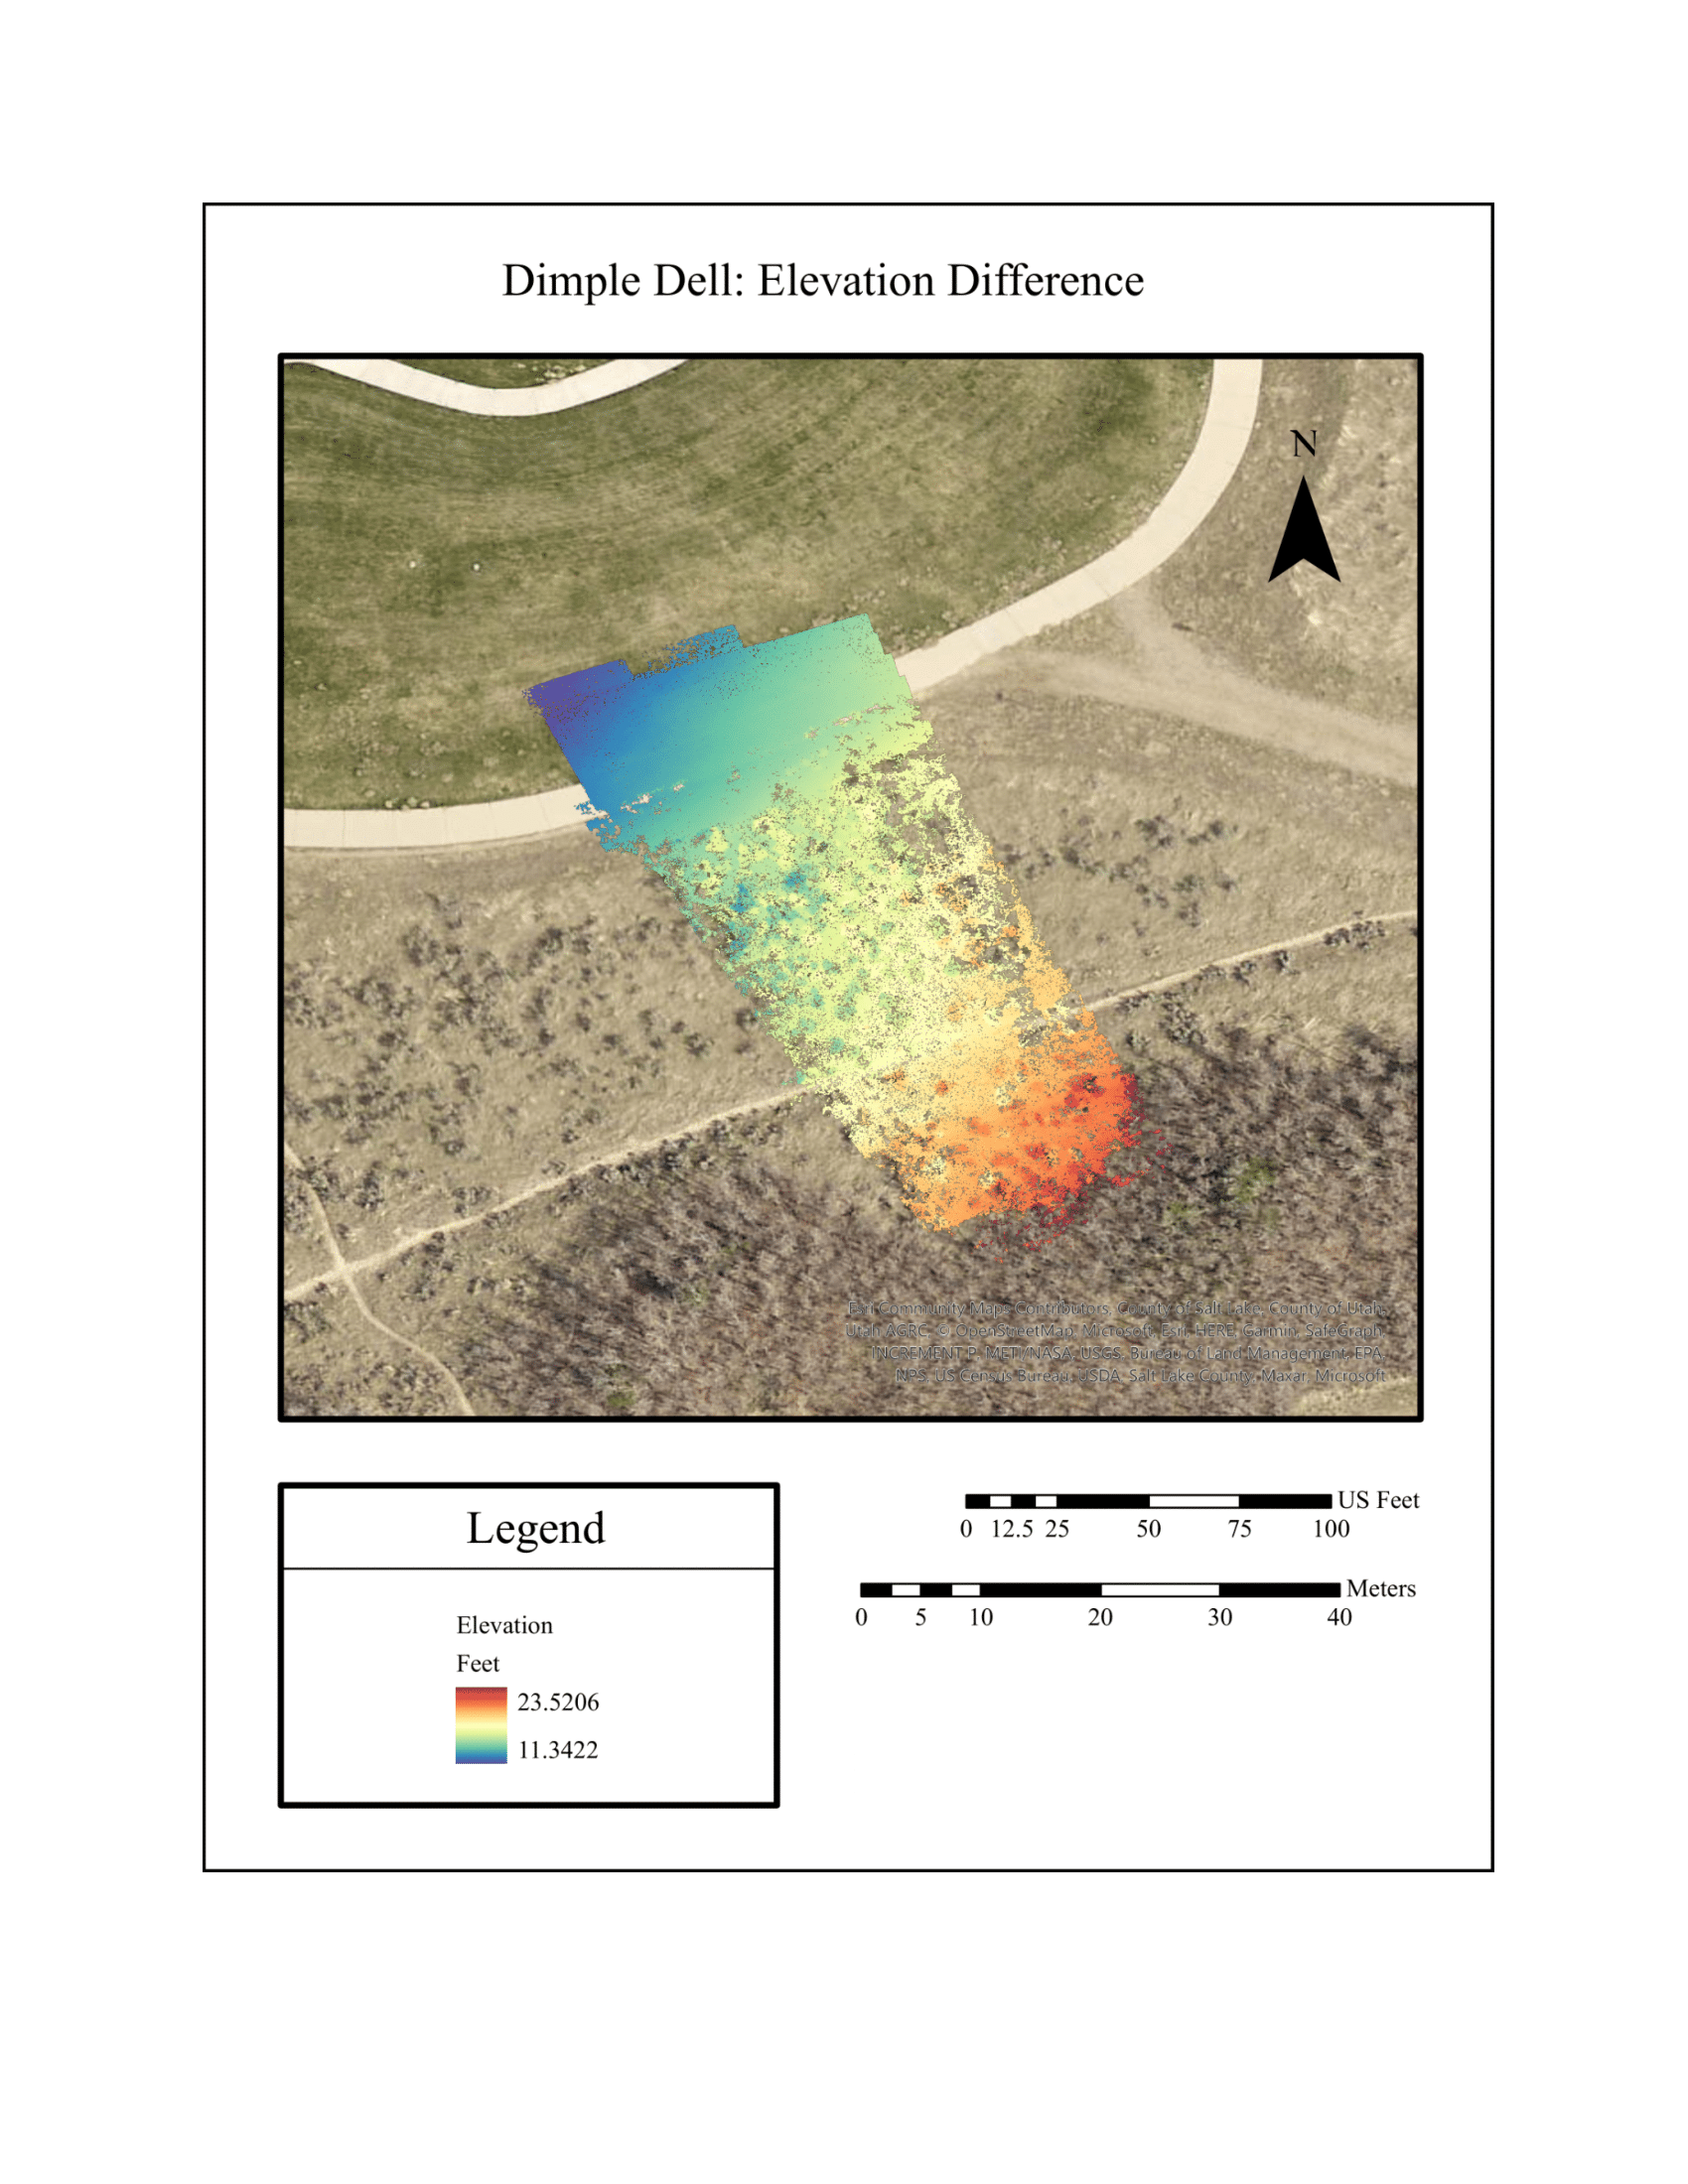
Dimple Dell: Elevation Difference
The above map shows the difference between the first east-to-west flight and the second north-to-south flight in their elevations. The differences in elevation are measured in feet, with the lowest value being 11.3422 and the highest value being 23.5206. From analyzing the map, it looks like the elevation difference rises as the observation moves more downward. The symbology used is Bright Spectral with a satellite image basemap.
Discussion
It’s clear that there was human error in the north-and-south flight or model processing in Agisoft Metashape, resulting in poorly aligned layers for the north and south maps with its DEM, hillshade, slope, as well as the difference maps. Also with the drone, the camera angle should not have been 90 degrees—if it had been set somewhere from 70 to 80 degrees, the amount of overlap, which was measured as 70% to 80% in the application, could have been increased. The altitude of the device’s flight should have been set higher than 35 feet in order to capture multiple GCPs that were placed within the target location to make it easier to georeference—while a closer 35 feet altitude meant there would be more fine detail in the final product, it did affect the resolution poorly in this case for two main reasons, the lack of overlap from the camera angle and the GCPs were too spread out to capture.
Researchers stressed that 1) many photos should be taken to ensure high resolution, and particularly 2) that photos with multiple angles and great overlap are important (Westoby et al., 2012); this was an issue that was encountered while aligning images in Agisoft Metashape—after alignment, a dialog box popped up notifying the user that some photos failed to align. Another issue that was encountered, especially due to the drone altitude and camera angle, was the difficulty georeferencing; creating flag targets in Agisoft Metashape was done manually for every single photo, but merely estimating the pathway for the drone to take on the application ended up omitting the sixth GCP, making georeferencing less accurate. Mistakes that ended up causing the second flight to shift approximately 3 to 5 feet downward in the models was because the unused GCPs were not set aside far enough and were captured in the photos.
Beyond the observable aspects of the models, from the Agisoft Metashape reports on the first and second flights the margins of errors possess significant gaps from one another. Concerning the camera errors, the first east-to-west flight has a total error of 46.1694 centimeters, whereas the second north-to-south flight has a total error of 6.59357 meters—this is a vast gap between the two. The accuracy of these flights were also probably affected by the difference in the number of photos taken, with the first flight having 136 and the second flight having 112, a difference of 24 photos.
Conclusion
It was initially hypothesized that neither the east-to-west nor north-to-south would have an advantage over the other, with the reasoning behind it being the automated settings. However, in this project’s case the first east-to-west flight had produced the most faithful model and representation of the study area, with the margins of error’s units being centimeters as opposed to the second north-to-south flight’s meters.
Considering this, the question still stands on whether or not different transect line paths would affect the quality of the terrain analysis models, given that all settings are constant and consistent. The execution of the project did not fully answer this research question, but it is possible that the east to west transect lines did more well because it produced more photos despite having a shorter path, which could be attributed to the fact the drone slowed down in order to move onto the next transect line, and this is combined with the fact that the interval between photo-taking was two seconds. Overall, the models that were constructed were fairly representative of the target location, and the goals were reached in understanding how GPS error and several maps of the different terrain analysis both relate to surveying and GIS.
References
Oniga, V., Breaban, A., Pfeifer, N., & Chirila, C. (2020). Determining the Suitable Number of Ground Control Points for UAS Images Georeferencing by Varying Number and Spatial Distribution. Remote Sensing, 12(5), 876. https://doi.org/10.3390/rs12050876
Westoby, M., Brasington, J., Glasser, N., Hambrey, M., & Reynolds, J. (2012). ‘Structure-from-Motion’ photogrammetry: A low-cost, effective tool for geoscience applications. Geomorphology, 179, 300–314. https://doi.org/10.1016/j.geomorph.2012.08.021
Yu, J., Kim, D., Lee, E., & Son, S. (2020). Determining the Optimal Number of Ground Control Points for Varying Study Sites through Accuracy Evaluation of Unmanned Aerial System-Based 3D Point Clouds and Digital Surface Models. Drones, 4(3), 49. https://doi.org/10.3390/drones4030049